INTERACTIVE REPORTING FOR MARKET RESEARCH

There is an increasing demand for interactive access to survey results. Many clients and stakeholders are asking for secure and instant visualisation of their data online to complement or even replace static reports. Online dashboards provide a dynamic way to slice and dice data to reveal more nuggets of insight that may otherwise have remained hidden.

There are many online dashboard platforms, typically built for the BI (Business Intelligence) industry, however using these platforms for Market Research or Survey data can be quite challenging, to say the least. The E-Tabs Dashboard team understand the unique requirements of market research reporting and have the tools to support your needs.

Play Video

E-Tabs Dashboard Services

Our experienced Dashboard team can design, build and deploy your perfect market research dashboard

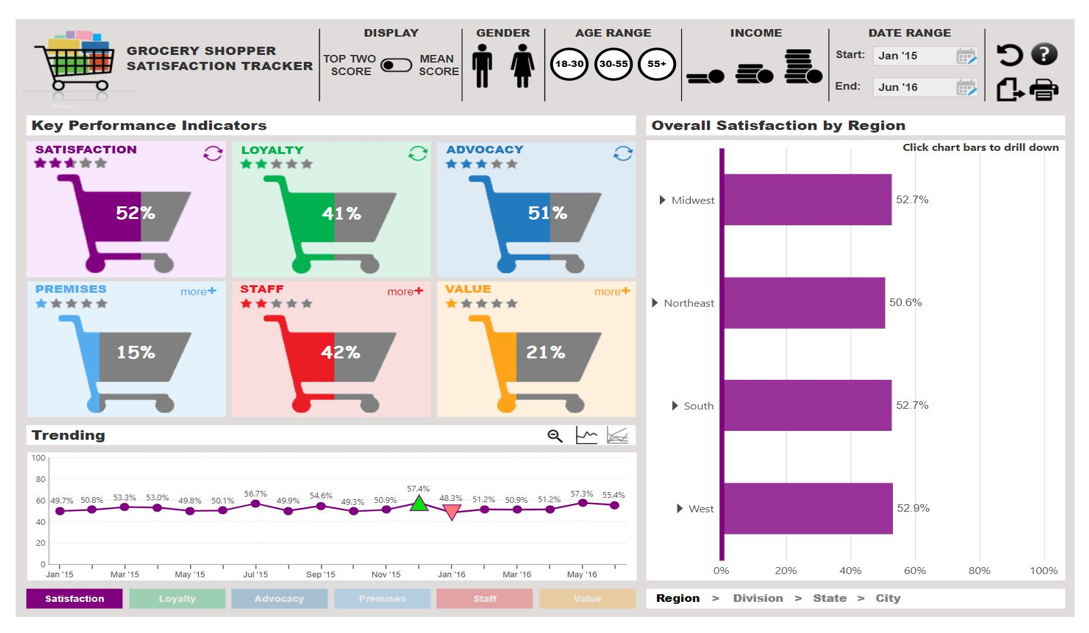
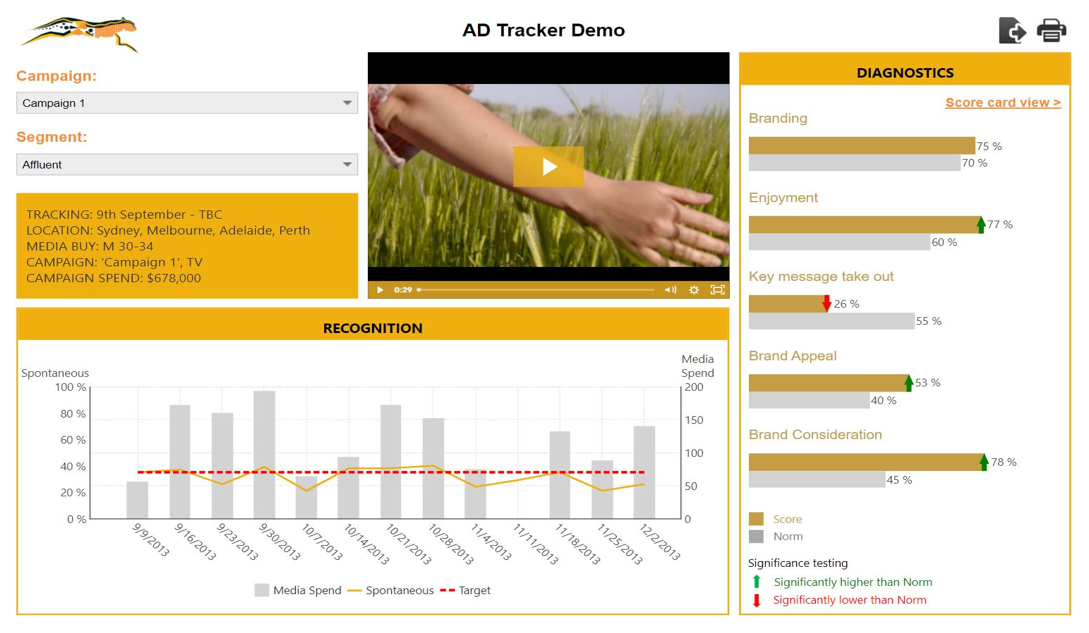
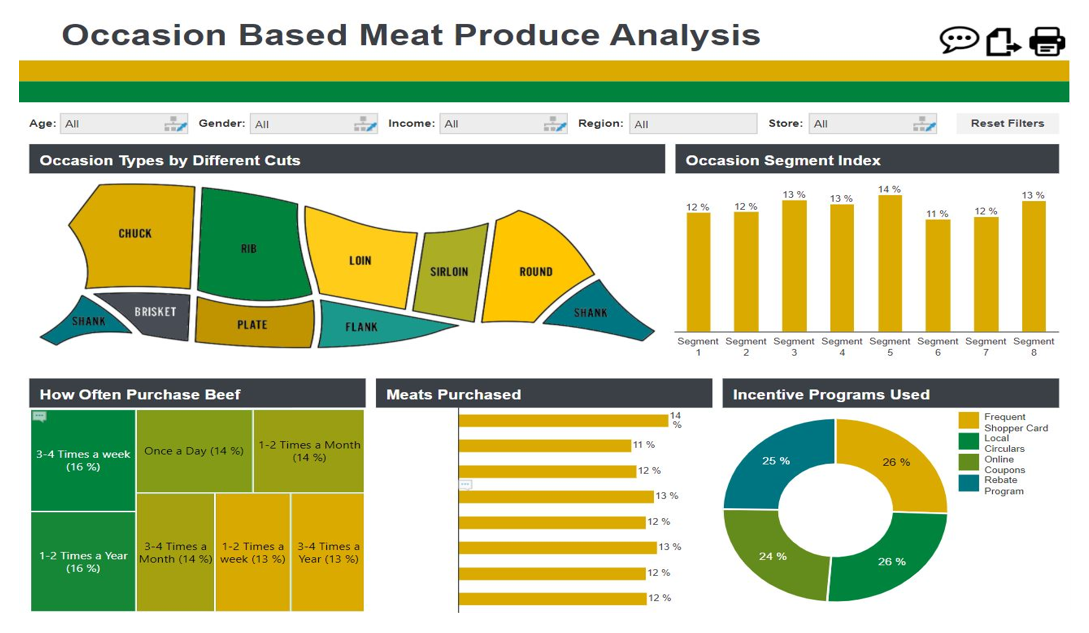
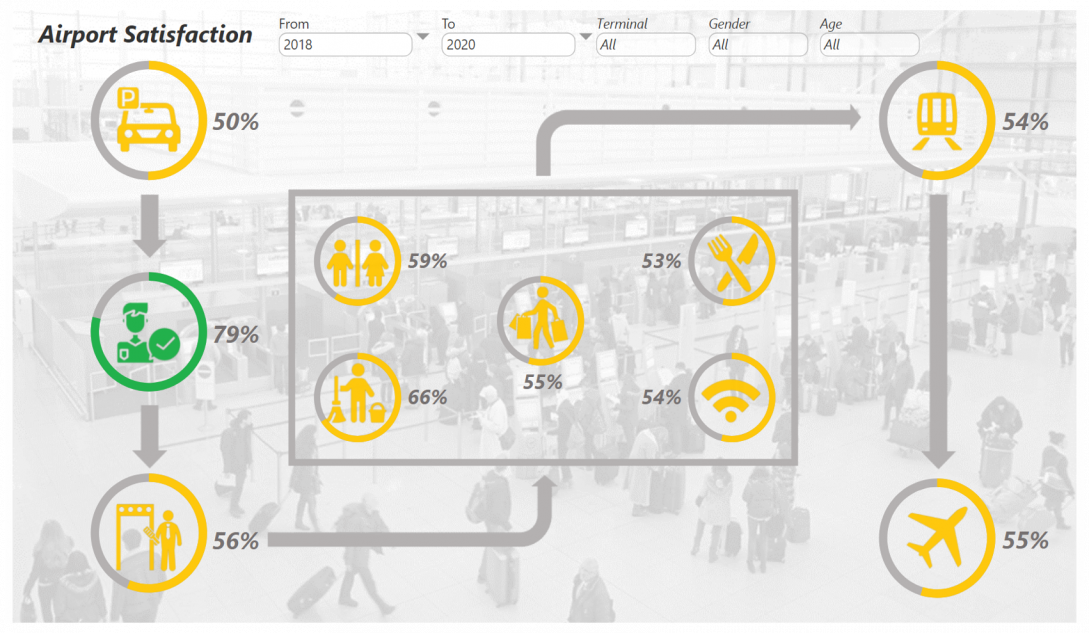
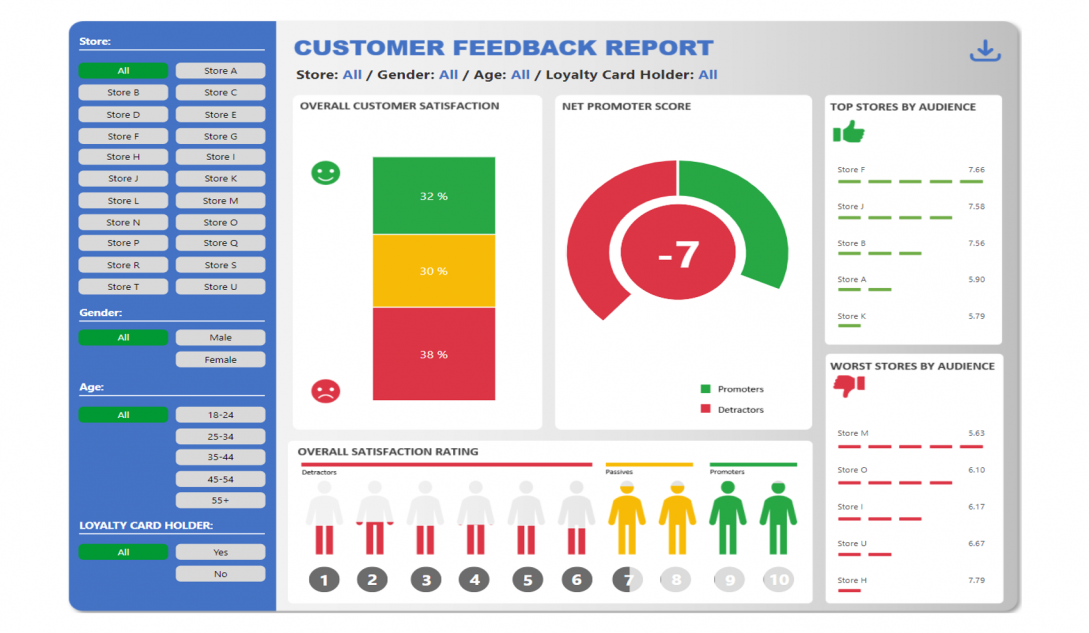
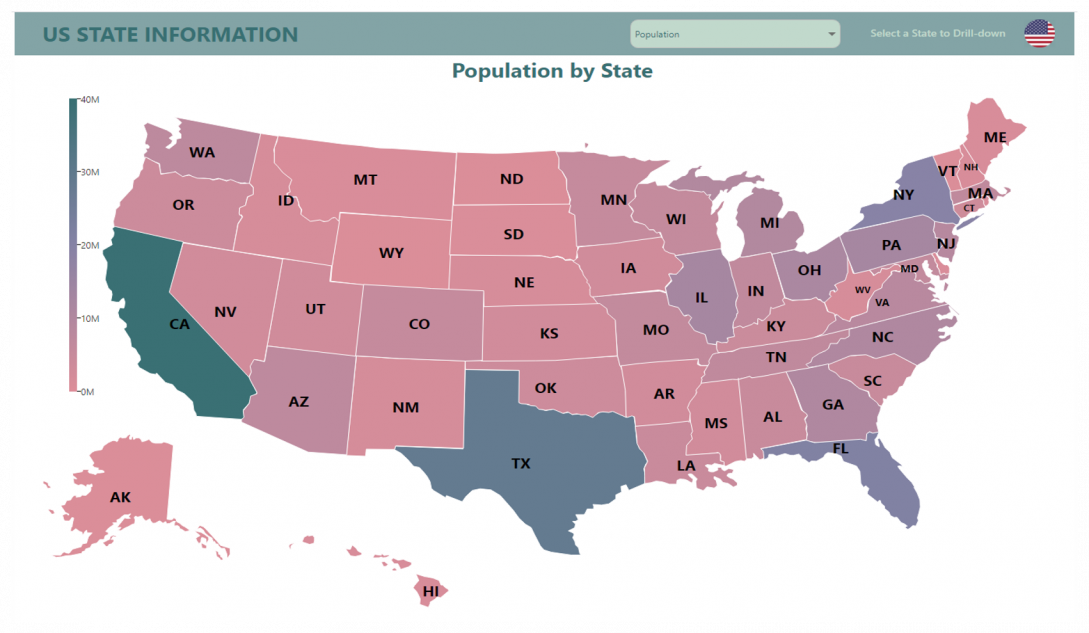
Our award-winning Dashboard Service team provides a truly bespoke service, responsive to the needs of your market research project, ensuring you'll deliver a visually engaging dashboard which tells the story of your data. We will take care of all aspects of your dashboard, starting from design and going all the way through to secure hosting and ongoing maintenance, allowing you to stay focused on the real business of research.

Editable PowerPoint Exports

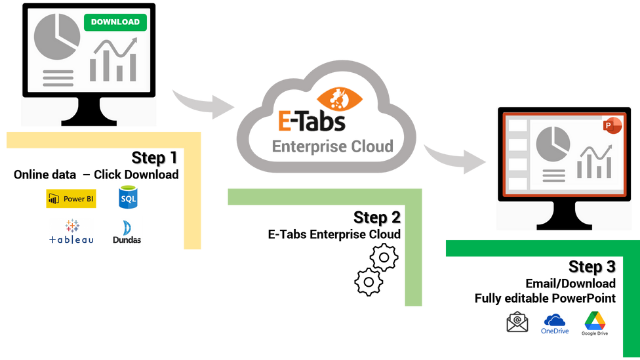
Are you looking to generate EDITABLE PowerPoint, Google Slides/Sheets exports from your Online Dashboards?

This export capability can be provided for any Dashboard we create for you, as well as added to any of your existing Dashboards on platforms such as Tableau, PowerBI and many others.

                               Export data from your chosen, filtered dashboard views into your own pre-defined PowerPoint and Google Slides/Sheets templates - those exported reports will include full editable, native charts matching your branded Dashboard design.

Why Use Us?

E-Tabs has been providing innovative reporting solutions for the market research industry for nearly 3 decades.  With an intimate understanding of MR data and how it needs to be handled and reported, we can avoid all those technical challenges when it comes to creating highly functional yet visually engaging, interactive dashboards.  We can read your data from an SPSS sav file, Excel or other industry-standard analysis outputs, raw or aggregated, without the need for any complex data transformations.  Our dashboards 'speak MR' so can be built to dynamically calculate nets, apply weighting, stat testing and low-base conditions, handle multi-response data and perform many more functions that are unique to MR.

Our skilled team of DataViz consultants can bring your project to fruition with true creativity and data design. Starting from a blank canvas, or if you prefer, modelling the Dashboard on an existing PowerPoint 'template', we will custom-design your dashboard with your choice of logos, iconography, branding, fonts, theme colours and layout. We can advise which data visualisations; chart types and widgets will suit your project and tell your story in the best way.  We will inject life into the data through interactive filters, custom data handling rules, and conditional formatting so your clients or stakeholders will enjoy interacting with the dashboard looking for nuggets of insights.

Your Dashboard will be hosted securely on our Microsoft Azure, GDPR-compliant cloud-based servers, offering 99.9% access uptime. We will take care of all the technology needed so you don't have to worry about things like firewalls, backups, security and updates.  Dashboards can be viewed with any web browser on any device without any need to install software or plugins.

Sometimes you don’t want all your users to see all the data!  Tell us what's needed, and we will set-up hierarchical access to control who can see what and under which conditions.  For example, in a typical global customer satisfaction study you may want to differentiate between global, regional, country or even individual store manager.  The global manager will see everything, regional manager will see just their region, etc.

At E-Tabs we won’t just provide you with a solution and walk away! From the outset we put ourselves into your shoes, understanding your project needs from start to finish and building your Dashboard with regular communication at every stage. Our team are passionate about ensuring our clients maximise a return on their investment in entrusting their reporting needs with us. In the event of any issues will work tirelessly to resolve them in the fastest possible time frame, giving you and your clients peace of mind knowing someone is always available to help. It is this responsiveness and attention to detail that earned us the MRS Award for “Best Support Services”.


NEED A DASHBOARD QUOTE?

If you have a project you'd like to consider reporting online in a Dashboard, please click on the button below and complete a short questionnaire to tell us more. Once completed, a member of the team will be in touch shortly.


Contact Us

We have offices in three strategic
locations around the globe.

Europe

London (HQ)
+44 (0) 20 8205 4665

Unit 2, Technology Park
Colindeep Lane
London
NW9 6BX, UK

North America

Chicago
+1 888 823 8227

Asia Pacific

Auckland
Got a question or comment?
Would you like to know more about any of our products and services?
Then fill out the form below and we’ll be in touch promptly.
Book a free consultation